
World Airport Passenger Traffic: Atlanta Tops the Ranking for a Third Year, Four Chinese Airports Reach the Top 30
- ACI
- airport passenger rankings
- Atlanta airport
- Dubai International
- Heathrow
- aviation hubs
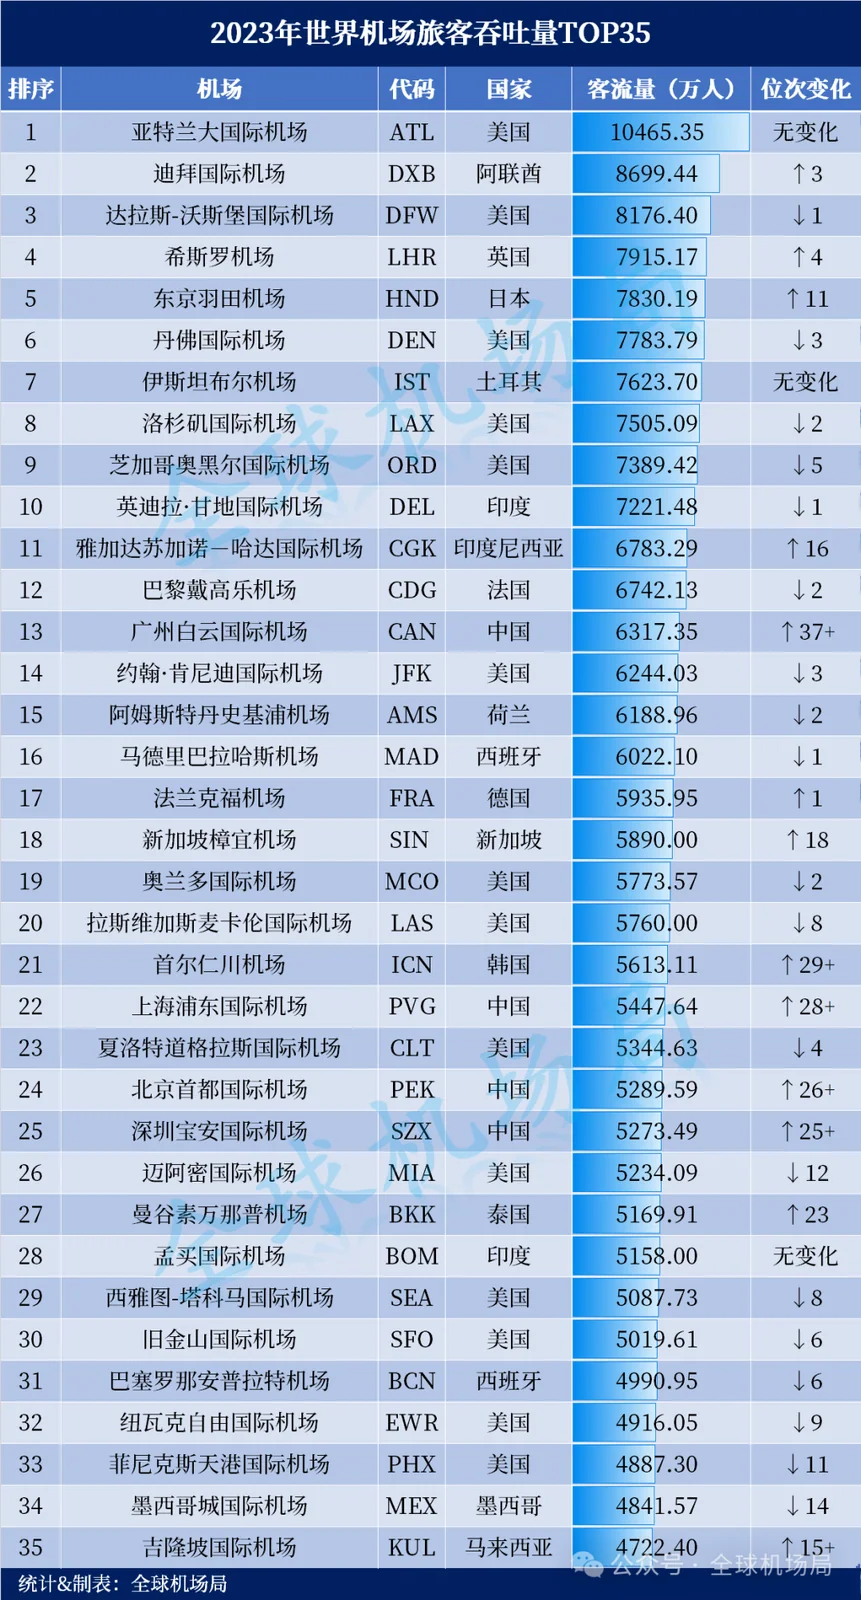
In March 2024, Airports Council International (ACI) published its ranking of the world's busiest airports by 2023 passenger traffic. It was the first full year after the pandemic with almost no travel restrictions, which makes the table the first honest comparison with the pre-2019 order: Atlanta Hartsfield-Jackson stayed first for a third year with 104.65 million passengers, Dubai International rose to second for its best ranking ever, London Heathrow became Europe's number one again, and Tokyo Haneda returned to the top five.
Beyond the order, the list records where demand came back. Hubs in the Middle East and Asia recovered faster than those in Europe: Seoul Incheon climbed more than 29 places and Jakarta Soekarno-Hatta 16. Chinese airports rebounded from a low 2022, with Guangzhou Baiyun, Shanghai Pudong, Shenzhen Bao'an and Beijing Capital all entering the top 30 — Guangzhou had been outside the top 50 only a year earlier.
1. The top ten: Atlanta first for a third year, Dubai at a record high
The ranking is ordered by 2023 passenger traffic in tens of thousands; the last column is the change in rank against 2022.
| Rank | Airport | Code | Country | Passengers (10,000s) | Rank change vs 2022 |
|---|---|---|---|---|---|
| 1 | Atlanta International | ATL | United States | 10465.35 | no change |
| 2 | Dubai International | DXB | UAE | 8699.44 | up 3 |
| 3 | Dallas-Fort Worth International | DFW | United States | 8176.40 | down 1 |
| 4 | Heathrow | LHR | United Kingdom | 7915.17 | up 4 |
| 5 | Tokyo Haneda | HND | Japan | 7830.19 | up 11 |
| 6 | Denver International | DEN | United States | 7783.79 | down 3 |
| 7 | Istanbul Airport | IST | Türkiye | 7623.70 | no change |
| 8 | Los Angeles International | LAX | United States | 7505.09 | down 2 |
| 9 | Chicago O'Hare International | ORD | United States | 7389.42 | down 5 |
| 10 | Indira Gandhi International | DEL | India | 7221.48 | down 1 |
The cut-off for the top ten sits at 72.21 million, held by Delhi's Indira Gandhi. Atlanta is the only airport above 100 million and held first place without moving; its traffic has long rested on a vast domestic network rather than a high share of international routes.
Dubai's 86.99 million and three-place gain is the most telling line in the table. It pushed Dallas-Fort Worth down to third and took the highest position in its history. For an airport whose business is built on long-haul connections, that says the 2023 recovery in distant travel was unusually complete.
2. Heathrow back on top in Europe, Haneda back in the top five
Heathrow rose four places to fourth with 79.15 million, taking back the number one spot in Europe — after being passed by other European hubs in 2022, it recovered the position in 2023. With only two runways and tight slot constraints, Heathrow's gain came more from load factors and aircraft mix than from adding flights.
Tokyo Haneda climbed eleven places to fifth on 78.30 million, the biggest jump inside the top ten. Haneda carries an extremely dense domestic network alongside most of Tokyo's business and short-haul international flying, and once Japan reopened in 2023 it recovered visibly faster than Narita.
Istanbul is the other airport in the top ten whose rank did not move, holding seventh on 76.24 million. Denver fell three places to sixth, Los Angeles two to eighth and Chicago O'Hare five to ninth — declines that reflect faster-recovering hubs overtaking them as much as any fall in their own traffic.
The rest of the European group sits inside the top 20 — Frankfurt, Amsterdam, Paris CDG and Madrid among them — a reminder that Europe's recovery was broad rather than concentrated in a single hub.
3. Asia's rebound: Incheon up 29, Jakarta up 16
Widen the view to the top 35 and the Asian climbs are steeper. Seoul Incheon ranked 21st with 56.13 million, up more than 29 places on 2022. Jakarta Soekarno-Hatta ranked 11th with 67.83 million, up 16 places and one step outside the top ten. Asian airports clearly recovered more sharply, with Incheon and Jakarta the clearest examples after Dubai and Haneda inside the top ten.
The two rebounded for different reasons. Incheon leans on medium- and long-haul connections and duty-free spending; Jakarta leans on the sheer size of its domestic market. Indonesia is the world's largest archipelagic state, and domestic traffic alone is enough to push one airport close to the global top ten. Both climbs also show what a single world ranking blends together: an airport that sells connections and an airport that sells reach inside one country.
4. Four Chinese airports in the top 30
Chinese airports are the biggest movers in the table. Guangzhou Baiyun ranked 13th with 63.17 million, up more than 37 places on 2022. Shanghai Pudong took 22nd with 54.48 million, up more than 28. Beijing Capital took 24th with 52.90 million, up more than 26, and Shenzhen Bao'an 25th with 52.73 million, up more than 25.
Guangzhou's position deserves emphasis. It was outside the world's top 50 in 2022 and returned to 13th within a year, the largest gain anywhere in the top 35. Beijing Capital and Shenzhen Bao'an finished about 160,000 passengers apart, in adjacent places, which suggests their recovery ran at almost the same pace through 2023. The compilers expect more Chinese airports to move up again in the 2024 ranking.
5. What the table does and does not tell you
First, the numbers are passenger movements, not people. An airport counts each arrival and each departure, and connecting passengers are handled differently from airport to airport, so rank reflects how many movements a field processed rather than how many travellers chose it as a destination. That is part of why Atlanta, built on domestic trunk routes, can stay ahead of Dubai and Heathrow.
Second, 2023 was a recovery year, and large rank gains lean heavily on a weak 2022 base. The table gives no comparison with 2019, so "up 37 places" or "up 29 places" should be read as the speed of recovery against 2022, not as overtaking pre-pandemic levels. Judging whether a hub is truly back needs its own route-level data.
Third, a passenger ranking measures scale, not experience. Punctuality, minimum connection times, baggage mishandling rates and international reach are all absent. A top-ten airport can still take twenty minutes to walk between gates, and an airport ranked outside the thirties can turn a connection in forty. The table is a thermometer for the industry's shape, not travel advice. What the next edition will show is whether the 2023 gains hold once the base effect fades.
6. The 2025 update: three years on
The 2025 full-year ranking, published in March 2026, shows how much the table moved. Atlanta stayed first with 106.30 million, a fifth year at the top but down 1.6%. Dubai (95.20 million) and Haneda (91.43 million) followed. Shanghai Pudong reached the global top five for the first time with 84.99 million, and Guangzhou Baiyun rose to ninth with 83.58 million. Thirteen Chinese airports made the top 50, four the top 20 and six the top 30; Hong Kong climbed eight places to 24th with 61.05 million.
The biggest change since 2023 is not the champion but the depth of the Chinese field: four airports in the top 30 in 2023, 13 in the top 50 and six in the top 30 in 2025. The 2023 table is best read as a snapshot of the recovery, while the 2025 data describes the current shape. The full latest ranking is in World Airport Passenger Traffic.
Related links
- On this site: Atlanta Hartsfield-Jackson (ATL), Dubai International (DXB), London Heathrow (LHR), Tokyo Haneda (HND), Guangzhou Baiyun (CAN), Shanghai Pudong (PVG), Seoul Incheon (ICN), Beijing Capital (PEK)
- Country pages: United States (US), China (CN)
- Wikipedia: Hartsfield–Jackson Atlanta International Airport, Dubai International Airport, Heathrow Airport, Guangzhou Baiyun International Airport
- Baidu Baike: Hartsfield–Jackson Atlanta International Airport, Dubai International Airport
Image source: ACI data, tabulated by Global Airport Bureau and compiled by Xiaohu Aviation Analysis. Rankings and traffic figures follow ACI's published basis; airport-level definitions (including how connecting passengers are counted) can differ, so check ACI's published figures before quoting.
More articlesTravel notes

Adelaide Airport Wins Two Skytrax Awards for Staff and Regional Service
Adelaide Airport has been named Best Airport Staff in Australia/Pacific for the first time and Best Regional Airport in Australia/Pacific for the fourth time in five years at the Skytrax World Airport Awards in London. Passenger numbers passed nine million in 2025, international traffic grew more than 20%, and a A$600 million expansion called Project Flight is under way.4 min read
Buying Whisky at Airport Duty-Free: A Global Shelf Guide by Flight Time
From Taoyuan and Changi to Heathrow and Sydney, airport duty-free is where whisky's travel-retail exclusives live: single casks, cask strength and no local duty. A region-by-region survey of what stood on the shelves around Chinese New Year 2020, plus how to choose by age, cask, bottle size and the liquid rules on connections.7 min read