The World's Top 10 Cargo Airports: Hong Kong Still First, Eight of Ten in China or the US
- air cargo
- ACI
- cargo airport rankings
- Hong Kong International
- Memphis airport
- Shanghai Pudong
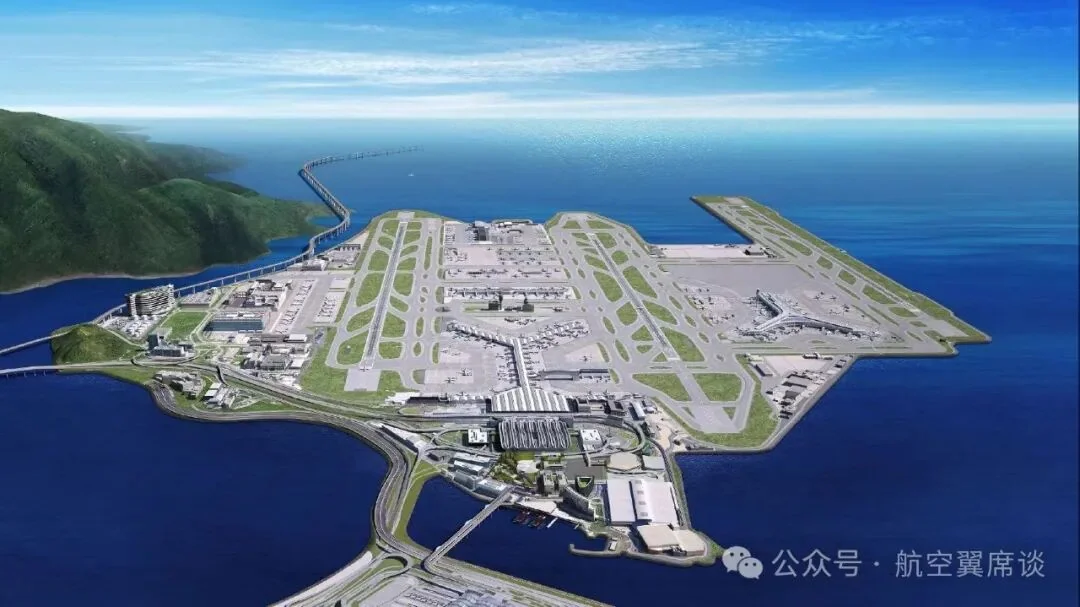
In April 2024, Airports Council International (ACI) published its ranking of the world's ten largest cargo airports for 2023, ordered by cargo throughput. Hong Kong International stayed first with 4.33 million tonnes, Memphis second with 3.88 and Shanghai Pudong third with 3.44 — the only large cargo hub in the top five to post double-digit growth.
This list reads nothing like the passenger ranking. Global air cargo fell 3.1 per cent in 2023, still coming down from the pandemic-era rate spike, yet the names barely changed; what moved was the order. Anchorage climbed from sixth in 2019 to fourth, Miami from twelfth to seventh, Louisville slipped from fourth to sixth and Taipei Taoyuan from ninth to tenth. Cargo rankings follow trade cycles, not tourists.
1. The table: Hong Kong first, tenth place at 2.11 million tonnes
| Rank | Airport | Code | Country/Region | 2023 cargo (million tonnes) | Year on year | vs 2019 | 2019 rank |
|---|---|---|---|---|---|---|---|
| 1 | Hong Kong International | HKG | Hong Kong, China | 4.33 | +3.2% | −9.9% | 1 |
| 2 | Memphis International | MEM | United States | 3.88 | −4.0% | −10.2% | 2 |
| 3 | Shanghai Pudong International | PVG | China | 3.44 | +10.4% | −5.3% | 3 |
| 4 | Anchorage International | ANC | United States | 3.38 | −2.4% | +23.1% | 6 |
| 5 | Seoul Incheon International | ICN | South Korea | 2.74 | −6.9% | −0.7% | 5 |
| 6 | Louisville International | SDF | United States | 2.73 | −11.1% | −2.2% | 4 |
| 7 | Miami International | MIA | United States | 2.53 | +1.0% | +20.7% | 12 |
| 8 | Doha Hamad International | DOH | Qatar | 2.36 | +1.5% | +6.3% | 8 |
| 9 | Los Angeles International | LAX | United States | 2.13 | −14.9% | +1.9% | 13 |
| 10 | Taipei Taoyuan International | TPE | Taiwan, China | 2.11 | −16.8% | −3.2% | 9 |
The figures are ACI's; the year-on-year column compares 2023 with 2022, and "vs 2019" shows how far each airport has recovered against the pre-pandemic year. Tenth place sits at 2.11 million tonnes, 2.22 million below first — roughly Pudong's entire annual throughput — so the gap between the leaders and the chasing group is wider than on the passenger side.
Hong Kong's first place is about structure. It has long been the world's busiest international cargo airport, with re-export trade and Pearl River Delta manufacturing feeding a dense schedule of freighter waves. But 4.33 million tonnes is still 9.9 per cent below 2019: this is a first place held while shrinking, not a return to the pre-pandemic peak.
2. 113 million tonnes: back to 95.4 per cent of 2019
Global airport cargo throughput was 113 million tonnes in 2023, down 3.1 per cent year on year and equal to 95.4 per cent of 2019. That recovery looks better than the passenger side, where many markets are still short of pre-pandemic levels.
The decline is not hard to explain. When ocean freight was disrupted and rates spiked, cargo shifted to air, handing airfreight exceptional demand through 2020–2022. As shipping normalised and the inventory cycle ran its course, that substitution demand left, so 2023's 3.1 per cent dip reads more like a return to normal than a slump. What genuinely grows the market is cross-border e-commerce parcels, which change the mix rather than the total: smaller pieces, higher urgency, more reliance on widebody belly capacity.
3. The top ten move 26 per cent of the world
Together the ten largest cargo airports handled 29.6 million tonnes in 2023, 26 per cent of the global market. Ten airports carrying a quarter of the world's airfreight is a high concentration by the standards of most industries.
It comes from network effects. The hub model requires freight to gather at one point and be redistributed, and the stronger the hub, the denser the freighter waves, the lower the unit cost, and the more traffic concentrates there. Anchorage is the purest example: it is not a source of cargo at all, but sits at the technical-stop position on trans-Pacific routings, which is enough for fourth place on 3.38 million tonnes and a 23.1 per cent gain over 2019 — the largest pre-pandemic recovery in the top ten. Doha follows the same logic in the Middle East: not a producer, but a place where widebody freighters connect South Asian, European and African traffic, so much of its 2.36 million tonnes neither originates in nor is destined for Qatar.
4. Eight of ten in China or the US
Five of the ten are American and three are Chinese — one mainland, one Hong Kong, one Taiwan — for eight seats in total. The pattern is plain: air cargo volume is tied to the size and structure of an economy. The United States is the world's largest economy and takes half the list; China has three airports, covering mainland manufacturing, Hong Kong re-export and Taiwan's electronics supply chain.
Look at the eight as a supply chain and the division of labour is clear. Memphis is FedEx's global hub and Louisville is UPS's Worldport; their tonnage comes from gathering parcels and sending them out again, not from local factories. Los Angeles and Miami are gateways, the first for trans-Pacific flows, the second for Latin America. Anchorage is a fuel and crew stop. On the Chinese side, Hong Kong and Shanghai Pudong are manufacturing and re-export doors, one serving the Pearl River Delta, the other the Yangtze Delta, both heavily dependent on electronics, machinery and cross-border e-commerce. Put another way, the five American airports mostly organise cargo flows, while the three Chinese ones are origins and gateways at once.
That also explains why the 2023 order moved so sharply. As substitution cargo went back to sea, airports whose mix leaned toward express and e-commerce held up, while those carrying more general freight did not. Miami (+1.0 per cent) and Doha (+1.5) steadied; Los Angeles (−14.9) and Taipei Taoyuan (−16.8) fell hardest. The difference was not airport capability but the goods behind them. The concentration also poses a strategic question for everyone else: if a quarter of the world's airfreight passes through ten fields, the remaining hubs are competing for a thin slice of connecting traffic.
5. Cargo and passenger rankings are two different logics
The same airport can sit in very different places on the two lists. Shanghai Pudong was third in the world for cargo in 2023 and 22nd for passengers; Taipei Taoyuan was tenth for cargo and outside the passenger top 35. Cargo measures the ability to move goods and passengers the ability to move people, and the two depend on entirely different facilities, traffic rights and sources of demand.
For a traveller, the useful reading is trend rather than ranking. Rising cargo volumes usually mean local manufacturing orders and exports are picking up, and that freighter movements — and therefore belly capacity — are denser. Falling volumes often show up before the economic data does. Treat the table as a health check on the trade cycle rather than a league table of airports. Nothing in it speaks to service either: cut-off times, cold-chain handling, customs dwell time and trucking links decide whether a forwarder actually routes freight through a given airport, and none of those appear in a tonnage figure.
6. The 2025 update: 128.9 million tonnes
Data published in 2026 put global air cargo at 128.9 million tonnes in 2025, up 2.9 per cent year on year, with Asia-Pacific hubs again dominating the top of the rankings (Cargo Newswire). Against 113 million tonnes in 2023, the industry has moved clear of the post-pandemic correction; cross-border e-commerce parcels remain the main source of growth.
The 2023 table is still useful: it records the first year after the rate spike and explains why Hong Kong, Shanghai Pudong and Anchorage are hard to dislodge. The full 2025 top ten should be taken from ACI and the individual airports; reading the two tables together shows the trend better than either year alone.
Related links
- On this site: Hong Kong International (HKG), Shanghai Pudong (PVG), Seoul Incheon (ICN), Miami International (MIA), Doha Hamad (DOH), Los Angeles (LAX)
- Country pages: China (CN), United States (US)
- Wikipedia: Hong Kong International Airport, Shanghai Pudong International Airport, Memphis International Airport, Incheon International Airport
- Baidu Baike: Hong Kong International Airport, Memphis International Airport
Image source: ACI data, compiled by Aviation Viewpoint. Cargo definitions (whether transit freight and mail are included) can differ between airports, so check ACI's published figures before quoting a ranking.
More articlesTravel notes

Adelaide Airport Wins Two Skytrax Awards for Staff and Regional Service
Adelaide Airport has been named Best Airport Staff in Australia/Pacific for the first time and Best Regional Airport in Australia/Pacific for the fourth time in five years at the Skytrax World Airport Awards in London. Passenger numbers passed nine million in 2025, international traffic grew more than 20%, and a A$600 million expansion called Project Flight is under way.4 min read
Buying Whisky at Airport Duty-Free: A Global Shelf Guide by Flight Time
From Taoyuan and Changi to Heathrow and Sydney, airport duty-free is where whisky's travel-retail exclusives live: single casks, cask strength and no local duty. A region-by-region survey of what stood on the shelves around Chinese New Year 2020, plus how to choose by age, cask, bottle size and the liquid rules on connections.7 min read