World's Ten Busiest Airports: Dubai Leads on 4.9 Million Seats as Pudong Climbs to Third
- airport rankings
- OAG
- seat capacity
- Dubai airport
- Shanghai Pudong Airport
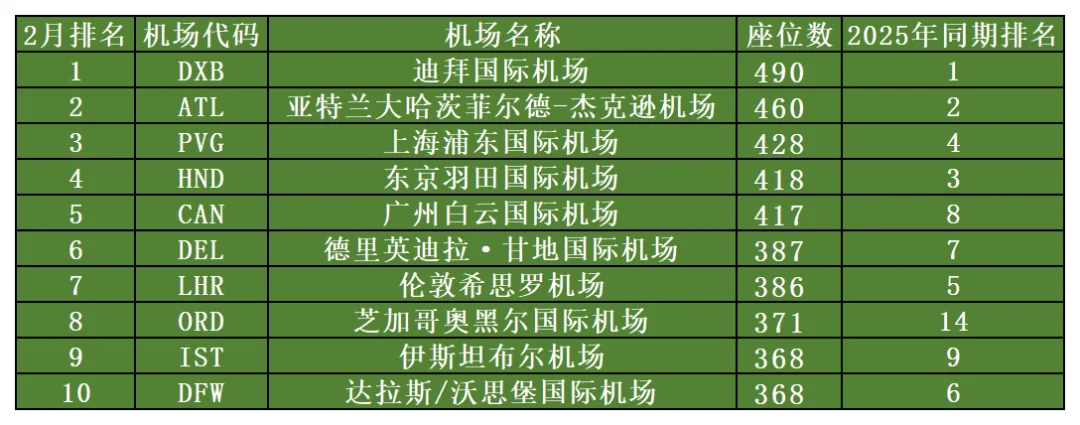
OAG has published its ranking of the world's ten busiest airports for February 2026. The measure is not passenger numbers but the seats on departures scheduled at each airport during the month — in other words, how much capacity airlines placed there. Dubai leads again with about 4.9 million seats, Shanghai Pudong moves up to third, and Guangzhou Baiyun climbs three places to fifth.
Seats and passengers are two different things. A seat is capacity an airline puts on sale at the planning stage; the passenger count only exists once the flight has operated, and the gap between the two is the load factor. Two further cautions apply to this table: February has only 28 days, which drags any month-on-month comparison down, and for the northern hemisphere it is one of the quietest months of the year.
1. Seat capacity measures supply, not people
OAG counts seats on scheduled passenger departures only — arrivals, cargo and charters are excluded. That tilts the table towards two kinds of airport. Connecting hubs fly widebodies with large seat counts per departure, so a single wave can produce an enormous number. Airports with dense domestic trunk routes fly narrowbodies at high frequency and accumulate seats just as effectively. What the table answers is how many seats flew out of an airport this month, not how many people actually went, which makes it a gauge of airline capacity decisions rather than of an airport's popularity.
Season matters too. By February the European and American holidays are over and schools are in session, so transatlantic and intra-European demand sits at its lowest point and airlines move capacity elsewhere or cut flights. The southern hemisphere is in high summer, yet all ten airports in the table are north of the equator: the centre of gravity of global capacity is still northern, and the low season is when that is clearest. A quiet month is also the easiest in which to see where airlines are placing their bets — Europe pulls back, and the Middle East, South Asia and Southeast Asia take up the slack.
2. Dubai leads, and both Chinese airports move up
The ten, as listed in the ranking table (seats in millions):
| Feb rank | Code | Airport | Seats (million) | Feb 2025 rank |
|---|---|---|---|---|
| 1 | DXB | Dubai International | 4.90 | 1 |
| 2 | ATL | Hartsfield–Jackson Atlanta | 4.60 | 2 |
| 3 | PVG | Shanghai Pudong | 4.28 | 4 |
| 4 | HND | Tokyo Haneda | 4.18 | 3 |
| 5 | CAN | Guangzhou Baiyun | 4.17 | 8 |
| 6 | DEL | Delhi Indira Gandhi | 3.87 | 7 |
| 7 | LHR | London Heathrow | 3.86 | 5 |
| 8 | ORD | Chicago O'Hare | 3.71 | 14 |
| 9 | IST | Istanbul | 3.68 | 9 |
| 10 | DFW | Dallas/Fort Worth | 3.68 | 6 |
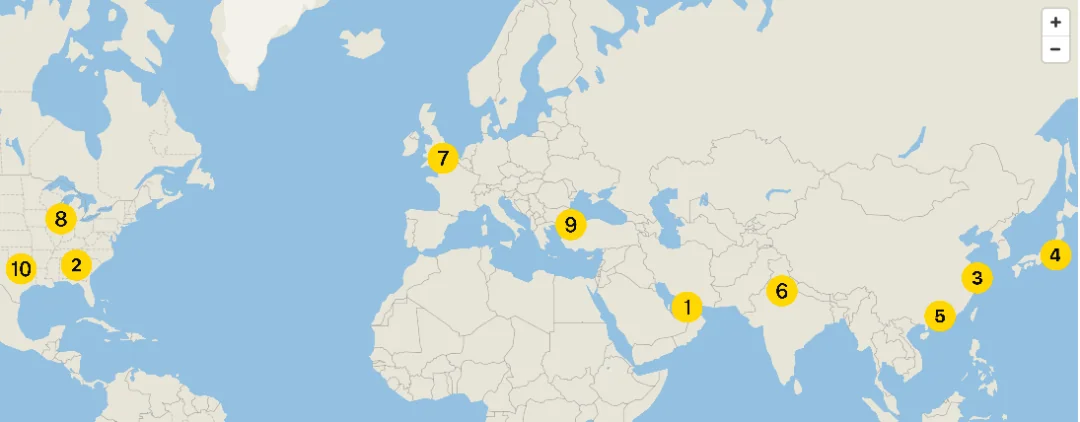
Geographically the list is entirely northern: three in the United States (Atlanta, Chicago O'Hare, Dallas/Fort Worth), two in China (Pudong, Baiyun), two in the Middle East (Dubai, Istanbul), and one each in the United Kingdom, Japan and India. Ninth-placed Istanbul and tenth-placed Dallas are level on 3.68 million seats, separated only beyond the decimal point.
The unit takes a moment to translate into something concrete. Spread over 28 days, 4.9 million seats is roughly 175,000 departure seats a day; tenth place, at 3.68 million, is about 131,000. The gap between first and tenth is some 44,000 seats a day — about 200 extra narrowbody flights.
3. Dubai keeps the lead, and is the easiest to rewrite
Dubai International (DXB) holds first place with almost 4.9 million seats. Its position at the crossroads of Asia, Africa and Europe lets its connecting model pull three continents into one terminal: passengers flying Europe to Southeast Asia or India to North America often change aircraft here, which keeps seat numbers high even in a quiet month.
It is also the most fragile entry in the table. The recent conflict in the Middle East has hit Dubai hard, and on current capacity plans its March ranking is likely to fall sharply — dropping out of the top ten would be no surprise. Istanbul (IST) holds ninth on geography and Turkish Airlines' expansion — the carrier has built the airport into a network covering more than 300 destinations — and is becoming a key node in the Europe–Asia–Africa triangle. It runs a similar connecting model but has been far less exposed this time.
What those hubs share is that a large share of their seats are sold to third-country passengers. A widebody leaving Dubai for Bangkok may carry British, Indian and Saudi travellers; the seat count reflects how far the network reaches rather than local demand.
4. Pudong and Baiyun: Spring Festival lifts February
Shanghai Pudong (PVG) rises from fourth to third on 4.28 million seats. Guangzhou Baiyun (CAN) moves from eighth to fifth on 4.17 million, a jump of three places. Both are tied to the Spring Festival travel rush: Chinese New Year falls in mid-February in 2026, and the overlap of trips home before the holiday and return trips after it makes this one of the year's heaviest stretches for domestic capacity.
For most northern-hemisphere airports February is a low season; for Chinese airports it often is not. That timing difference is exactly why Pudong and Baiyun both moved up the same table.
5. North America and Europe: winter capacity reshuffles
Atlanta (ATL) holds second on 4.60 million seats and remains the largest US hub. Chicago O'Hare (ORD) climbs from 14th to eighth on 3.71 million, which the source links to a milder winter and airlines concentrating capacity there, and Dallas/Fort Worth (DFW) slides from sixth to tenth, possibly on low-cost capacity adjustments. Tokyo Haneda (HND) is fourth on 4.18 million and Delhi (DEL) sixth on 3.87 million, so the Asia-Pacific market is no longer dominated by a single hub.
Europe looks softer. London Heathrow (LHR) holds seventh on 3.86 million but is two places lower than in February 2025, which the source tentatively attributes to visa policy, strikes or short-haul rail competition. Those are guesses. The structural point is firmer: Heathrow has two runways and chronically saturated slots, so its seat count has a fixed ceiling and little room to climb a table like this one.
6. How to use a monthly table
A monthly seat ranking captures a moment of capacity planning; annual passenger traffic captures the year's outcome. Neither replaces the other. What the monthly view tells a traveller is whether an airport has plenty of flights this month and how wide the connecting options are — but more seats do not mean cheaper fares or better punctuality.
Related links
- On this site: Dubai (DXB), Shanghai Pudong (PVG), Guangzhou Baiyun (CAN), Chicago O'Hare (ORD), China (CN)
- Wikipedia: Dubai International Airport, Shanghai Pudong International Airport
- Baidu Baike: Dubai International Airport, Shanghai Pudong International Airport
Image and data source: Aviation Viewpoint, "February 2026: the world's ten busiest airports", with data from OAG. Seat counts are planned capacity and differ from what is flown and from passenger numbers; check the airport's and the airline's own sites before you travel.
More articlesTravel notes

Adelaide Airport Wins Two Skytrax Awards for Staff and Regional Service
Adelaide Airport has been named Best Airport Staff in Australia/Pacific for the first time and Best Regional Airport in Australia/Pacific for the fourth time in five years at the Skytrax World Airport Awards in London. Passenger numbers passed nine million in 2025, international traffic grew more than 20%, and a A$600 million expansion called Project Flight is under way.4 min read
Buying Whisky at Airport Duty-Free: A Global Shelf Guide by Flight Time
From Taoyuan and Changi to Heathrow and Sydney, airport duty-free is where whisky's travel-retail exclusives live: single casks, cask strength and no local duty. A region-by-region survey of what stood on the shelves around Chinese New Year 2020, plus how to choose by age, cask, bottle size and the liquid rules on connections.7 min read